Performance
pge-corp

This section shares our progress across key indicators for which we set annual targets. By reporting on a broad set of measures across the triple bottom line, we strive to show where we performed well, as well as where we have opportunities to strengthen our performance.
Performance
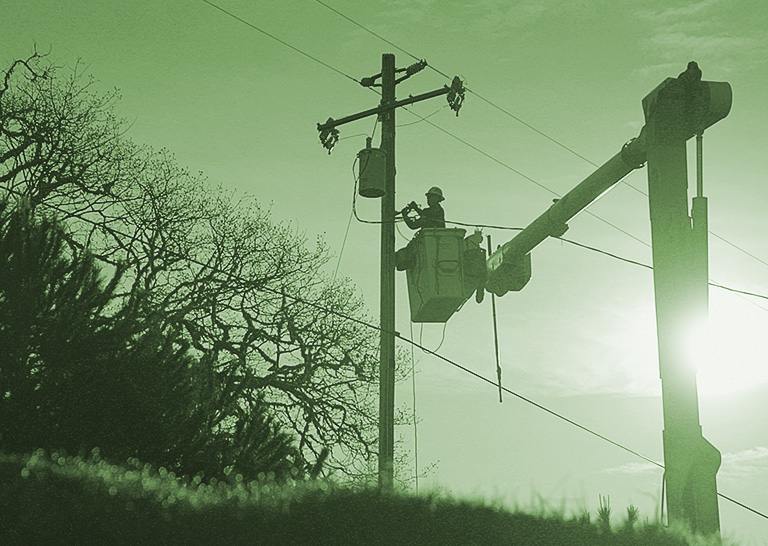
- Wildfire Safety
- Gas and Electric Operations
- Ethics and Compliance
- This measures the count of fire ignitions that result in fires equal to or greater than 100 acres in PG&E’s High Fire Threat Districts (HFTD) and reportable to the CPUC per Decision 14-02-015. A reportable fire incident per Decision 14-02-015 is a fire event that meets the following criteria: (i) ignition is associated with PG&E powerlines (both transmission and distribution); (ii) something other than PG&E facilities burned, and (iii) the resulting fire travelled more than one meter from the ignition point. Reportable Fire Ignitions that result in fires ≥100 acres in PG&E’s HFTD for which PG&E submits an Electric Incidents report are counted. If the ignition source for a fire ≥100 acres in PG&E’s HFTD is unknown or disputed, it will also be counted if PG&E records a financial reserve associated with that ignition.
- This new metric measures the rate of distribution and transmission ignition incidents occurring in high-risk weather conditions, where PG&E’s Fire Potential Index (FPI) for that location is R3 or above (R3+), in HFTD and/or High Fire Risk Areas (HFRA) normalized by 100,000 circuit miles. It is calculated as the sum of ignitions divided by the sum of R3+ circuit miles over a rolling 365 day period. This metric replaces Reportable Fire Ignitions, which in previous years, measured the number of fire incidents that met specific criteria.
- This is an equally weighted index that tracks the quality of three core wildfire mitigation programs as measured by: (i) percentage of distribution inspections performed in HFTD that pass the field quality verification reviews and contain no critical defects; (ii) percentage of transmission inspections performed in HFTD that pass the field quality verification reviews and contain no critical defects; (iii) percentage of the completed routine vegetation management in HFTD work that passes the quality verification reviews.
- This metric measures the percentage of risk reduced from addressing electric distribution wildfire-related tags open prior to 2023 in HFTD and HFRA.
- System Average Interruption Frequency Index (SAIFI) is the number of times the average customer experiences a sustained outage each year.
- System Average Interruption Duration Index (SAIDI) is the amount of time the average customer experiences a sustained outage (being without power for more than five minutes) each year.
- CEMI-5 is the total number of customers experiencing 5 or more sustained interruptions (planned or unplanned) and CEMI-10 is the total number of customers experiencing 10 or more sustained interruptions (planned or unplanned); both metrics are reported as a year-to-date measure for a rolling 12-month period. This metric is calculated as a composite index with total CEMI-5 and CEMI-10 scores broken out by performance within and outside EPSS zones. Total CEMI-5 and CEMI-10 scores contribute 60% and 40%, respectively, to the index. A higher composite index reflects better performance.
People
- Public Safety
- Coworker Safety and Engagement
People
- This metric represents average response time in minutes to an immediate response gas emergency order.
- This figure reflects the percentage of time that PG&E personnel are on site within 60 minutes after receiving a 911 call of a potential PG&E electric hazard.
- This metric refers to the sum of 10 performance indicators developed by the nuclear power industry for nuclear power generation.
- This measures the operating capability of mechanical equipment used as main control to reduce the enterprise risk of a large uncontrolled water release.
- This measures how frequently DART cases occur for every 200,000 hours worked, or for approximately every 100 employees.
- This measures how frequently drivers have an incident that could have been reasonably avoided per 1 million miles driven.
- Our Joy at Work survey includes the Joy Index, which is comprised of four questions: enjoying working for PG&E, feeling known at PG&E, feeling loved at PG&E, and feeling proud to work for PG&E.
Planet
- Climate and Clean Energy
- Enabling Customers
- Environmental Stewardship
Planet
- PG&E’s 2023 voluntary greenhouse gas emissions inventory is undergoing third-party verification before being finalized with The Climate Registry.
- While PG&E fell short of the annual RPS target, we remain on track for compliance with California’s RPS program, which follows a multi-year compliance period. Additionally, in 2023, PG&E supplied 100% greenhouse gas-free electricity to residential and business customers to whom we directly sell power. Eligible renewable resources include geothermal facilities, hydroelectric facilities with a capacity rating of 30 MW or less, biomass and biogas, selected municipal solid waste facilities, photovoltaic, solar thermal, wind facilities, ocean thermal, tidal current, and wave energy generation technologies. Data is sourced from PG&E’s Power Source Disclosure Report for the Base Plan product (bundled customers) and reflects RPS generation.
- These are new metrics that match how the CPUC set PG&E’s energy efficiency goals starting in 2024 and how PG&E measures MW achievements across its various customer energy efficiency programs. The goals measure the customer electricity and natural gas saved from PG&E’s codes and standards advocacy programs; “total system benefit” achieved by PG&E’s voluntary energy efficiency programs, which represents the dollar value that energy efficiency measures provide to the electric and natural gas system; and PG&E’s voluntary goal for avoided lifecycle generation capacity, which includes both codes and standards advocacy programs and voluntary energy efficiency programs. Under the prior methodology, PG&E exceeded its 2023 goals by achieving 1,730 GWh electricity saved, 42.8 million therms natural gas saved, and 328.1 MW avoided generation capacity.
- PG&E successfully completed our Land Conservation Commitment in mid-2024, achieving permanent protection of approximately 140,000 acres of PG&E-owned watershed lands. We fell short of the target to complete the transactions in 2023 primarily due to unanticipated delays in administrative and regulatory-related items.
California’s prosperity
- Customer Satisfaction and Energy Affordability
- Career Pathways
- Supply Chain Responsibility
California’s Prosperity
- This score measures the overall satisfaction of customers with the products and services offered by PG&E, as measured through a customer survey.
- The CPUC set the minimum CARE enrollment at 93% and PG&E set a goal of 99% enrollment for 2024.
- This figure measures the effectiveness of PG&E’s internal training program on a five-point scale through employee surveys on predictive data from employees on their ability to use training on the job.
- As part of the PowerPathway program development, we are currently re-evaluating metrics to track progress and performance.
- This represents the percentage of targeted suppliers that responded to an assessment and provided greenhouse gas emissions data and reduction goals.