©2026 Pacific Gas and Electric Company
pge-corp

As part of our climate goals, we’re working to reduce the carbon footprint of our operations. Our 2030 goal is to reduce our Scope 1 and 2 emissions by 50%, compared to a 2015 baseline.
Each year, PG&E reports its greenhouse gas emissions and climate change strategies to the CDP (PDF), an international not-for-profit organization that requests information on behalf of institutional investors.
Our approach
In the near-term, we’re reducing emissions from our operations by targeting methane emissions from natural gas operations, deploying clean fleet vehicles, promoting energy-efficient and more sustainable facilities, and removing sulphur hexafluoride (SF6) emissions from our electric substation equipment.
Reducing methane emissions from gas operations
PG&E is taking a comprehensive approach to reducing methane emissions, including:
- Enhancing our leak survey program that assesses about 44,000 miles of natural gas distribution pipeline every three years.
- Applying enhanced leak detection technologies and using an accelerated repair schedule for the largest emissions findings, known as PG&E’s Super Emitter Program.
- Modifying standard natural gas release or “venting” practices used to prepare transmission pipelines for maintenance, repair, or replacement projects.
- Replacing pneumatic controllers at compressor stations and natural gas storage facilities.
- Conducting quarterly leak surveys at compressor stations and natural gas storage facilities.
In 2024, we are focused on optimizing our methane emissions reduction program by looking at spend efficiency, ensuring that we prioritize larger emission leaks while staying in compliance with required leak repairs.
Measuring progress
Using 2015 emissions levels as a baseline value, PG&E reached 38% emissions reductions by the end of 2023, with an eye towards our 2030 climate target of 45%. This further exceeded California’s goal to reduce emissions from our natural gas pipeline system 20% by 2025.
Methane emissions
- These figures reflect a CPUC-approved methodology improvement, which transitioned from a population-based emission factor approach to a leak-based approach to measure emissions from customer meter sets and distribution metering and regulation stations. The figures also incorporate reporting requirements for CARB’s Oil and Gas Rule, which improves emissions accounting for transmission compressor stations and underground storage facilities.
- These values differ from PG&E’s inventory with The Climate Registry due to the use of a different global warming potential value for federal and state emissions reporting.
Continued areas of focus include:
- Reducing the Super Emitter threshold, so that more higher emitting leaks are prioritized for repair.
- Implementing drafting, cross compression, flaring, and clearance sharing—separately and in combination—to reduce the amount of natural gas released into the atmosphere from projects on our gas transmission system.
- Improving our reporting methodology to better capture reductions from avoided releases and making process improvements to drive more cross-compression across all transmission projects.
Vehicle fleet electrification
Across our vehicle fleet, PG&E managed approximately 14,410 on-road vehicles and related equipment at the end of 2023. Of these, about 1,300 were electric-based—ranging from hybrid-electric bucket trucks to fully electric vehicles—along with a small group of larger vehicles powered by CNG.
By integrating the latest available technologies and partnering with automakers to meet needs unique to our fleet operations, PG&E is working to reduce emissions and operating costs and expand our portfolio of low-emission vehicles.
We also remain focused on California’s adoption and implementation of the Advanced Clean Fleets regulation, designed to reduce transportation sector emissions from medium- and heavy-duty truck fleets, including our own. This regulation aligns with our 2030 fleet electrification goal and supports California’s long-term goal to achieve a zero-emission truck and bus fleet by 2045.
Measuring progress
PG&E continued to electrify our vehicle fleet, although overall emissions increased compared to the prior year largely due to an increase in the size of the fleet to support PG&E’s operations.
Transportation fleet greenhouse gas emissions
Key strategies included:
- Deployed 14 Ford F150 Lightning electric pick-up trucks and continued to work towards future deliveries of Freightliner MT50e full-electric underground cable construction vans. Placed orders for 175 Chevrolet Silverado electric pick-up trucks.
- Promoted coworker EV adoption through a network of about 700 ports at approximately 80 locations across our service area.
- Continued to leverage driver feedback technology on over 9,000 vehicles and pieces of equipment. In-cab alerts enabled on most of these vehicles can indicate hard braking, hard acceleration, exceeding the speed limit, and other actions that help promote safe driving behavior and fuel efficiency.
- Continued rolling out renewable diesel to every practical PG&E-owned fueling tank, using 3.9 million gallons of renewable diesel in our conventional vehicles in 2023 and reducing the associated carbon emissions.
While we work toward our fleet electrification goals, PG&E uses petroleum and renewable diesel to power many of the vehicles in our fleet. The following chart shows PG&E’s fuel usage over the past three years.
Transportation fuel consumed by Pacific Gas and Electric Company
Buildings and facilities
We continue to execute a multifaceted strategy to invest in key facility improvements, engage coworkers, and incorporate sustainability principles and continuous improvement into our building and facilities management.
We work to use energy more efficiently and adopt clean energy strategies at our office facilities and service centers. We’ve published a facilities sustainability standard for future workplace design, while remaining focused on building a more sustainable supply chain through environmentally preferable product choices and procurement strategies. We also power our service centers―about 60 buildings in Northern and Central California―with 100% solar energy through Pacific Gas and Electric Company’s Solar Choice program.
Measuring progress
Facility greenhouse gas emissions
Compared to 2022, our emissions increased about 20% due to a nearly 24% increase in electricity usage and about 53% increase in natural gas usage. Overall, aggregated energy use intensity, which is based on square footage, increased by 45%. The increase was largely driven by coworkers returning to offices following a period of remote work, weather-driven increases in electricity demand, and energy-intensive construction projects across the portfolio.
Despite this increase, we made progress in several areas during the year:
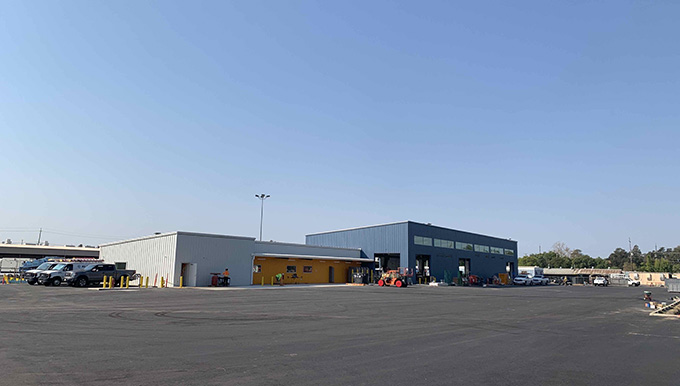
- Continued our commitment to expand on-site renewable energy through future solar installations. Our Napa Regional Center is expected to be operational in 2024 with a solar system and is designed to achieve LEED Gold certification. Future solar and efficiency projects are also underway at our Martin Service Center and Santa Cruz Service Center.
- Revised our Solar and Battery Design Standards to incorporate battery storage with new solar installations. This will allow us to store more renewable energy from our panels for later use to reduce peak demand.
- Progressed with additional space improvement projects including a lighting retrofit at the Oakland Service Center, resulting in estimated annual savings of 67,000 kWh and $17,000.
- Encouraged further energy conservation with 225+ facilities enrolled in PG&E’s demand response programs. Between Peak Day Pricing and the Emergency Load Reduction Program, we realized over $50,000 in cost savings by reducing load during events.
These figures represent electricity and natural gas usage at our office facilities and service centers.
Energy consumed at facilities1
- The data reflects the 12-month period from December to November. Between 175 and 197 sites reported electricity data for 2022 to 2023 and between 128 to 142 sites reported natural gas data between 2022 and 2023.
- Figures are reported in the industry standard of KBTU per square foot, which incorporates all the energy used in a facility into one comparative figure.
Reducing SF6 emissions from electric operations
PG&E is taking a multi-pronged approach to tackle SF6—repairing the highest leaking circuit breakers, implementing cylinder best management practices, phasing-in SF6-free equipment, and engaging in state and industry efforts to phase-out SF6 over time.
SF6 is commonly used by PG&E and other energy companies as an electrical insulating material in high-voltage circuit breakers and gas-insulated switchgear; but if it escapes to the atmosphere, it is a potent greenhouse gas.
Measuring progress
PG&E continued to reduce SF6 emissions from our electric operations. Our efforts included repairing or replacing 35 targeted circuit breakers in 2023 to reduce emissions.
SF6 emissions
- PG&E’s SF6 emissions vary from year-to-year as a result of enhanced calculation methods, as well as improved operational processes to reduce leaks and manage the company’s assets and inventory.
Measuring greenhouse gas emissions
PG&E has a long history of measuring, independently verifying, and publicly reporting our Scope 1, 2, and 3 greenhouse gas emissions. Under mandatory reporting requirements, PG&E reports certain greenhouse gas emissions to the California Air Resources Board and the U.S. Environmental Protection Agency on an annual basis. On a voluntary basis, PG&E reports our annual corporate greenhouse gas emissions inventory with The Climate Registry, a nonprofit organization.
PG&E’s Scope 1 & 2 Goal: Reduce emissions by 50% from 2015 levels by 2030
(Million Metric Tons CO2-e)1
- Scope 1 emissions are direct emissions from PG&E’s operations and Scope 2 emissions are indirect emissions from facility electricity use and electric line losses.
- PG&E’s 2023 voluntary greenhouse gas emissions inventory is undergoing third-party verification before being finalized with The Climate Registry.
PG&E’s Scope 3 Goal: Reduce emissions by 25% from 2015 levels by 2030
(Million Metric Tons CO2-e)1
- Scope 3 emissions are emissions resulting from value chain activities not owned or controlled by PG&E but can be indirectly impacted by PG&E actions.
- PG&E’s 2023 voluntary greenhouse gas emissions inventory is undergoing third-party verification before being finalized with The Climate Registry.
PG&E’s Scope 1, 2 and 3 greenhouse gas emissions
(Million Metric Tons CO2-e)
- PG&E’s 2023 voluntary greenhouse gas emissions inventory is undergoing third-party verification before being finalized with The Climate Registry.
- PG&E enhanced its emission calculation methodology for reporting year 2023.
- The emissions associated with purchased electricity are considered Scope 3 per The Climate Registry’s Electric Power Sector Protocol for the Voluntary Reporting Program, Annex I to the General Reporting Protocol, June 2009, Version 1.0. Beginning with our 2019 emissions reporting, PG&E has used the CEC’s Power Source Disclosure program methodology to calculate the CO2 emissions associated with the electricity delivered to retail customers. This methodology differed from prior reporting years and may result in lower emissions.
- Other Scope 3 emissions include the greenhouse gas emissions from business air travel, waste management and employee commuting.